Spredfast, a social media analytics firm partnered with CNET to track the election with social media in real-time. The company, which has shares social insights on everything from politics to Starbucks secret menu delved in to the minds of Twitter users to search reoccurring trends and determine election concerns, views, and results in terms of data.
“Social media helps set the tone of major worldwide events. Over the past 17 months, we saw the Republican and Democratic candidates exercising different social media strategies to communicate their agendas and rally supporters. The connections that social facilitated between candidates and voters, were monumental to their campaigns. On the sidelines, Spredfast was able to analyze what was resonating with audiences and where holes in conversation were developing, based on social enthusiasm and disagreement over time,” stated Ashley Brown, VP Global Communications at Spredfast.
Spredfast, VP of Research and Insights, Chris Kerns shared these insights on the election:
UPDATES and TAKEAWAYS on the day after the election:
We have mapped the five stages of grief (denial, anger, bargaining, depression, and acceptance) to see where the Twitterverse is on that timeline. It looks like lots of people have shown signs at each stage, but overall, Twitter is still stuck on the anger part. This morning, anger over the results has been overshadowing celebration by Trump supporters.
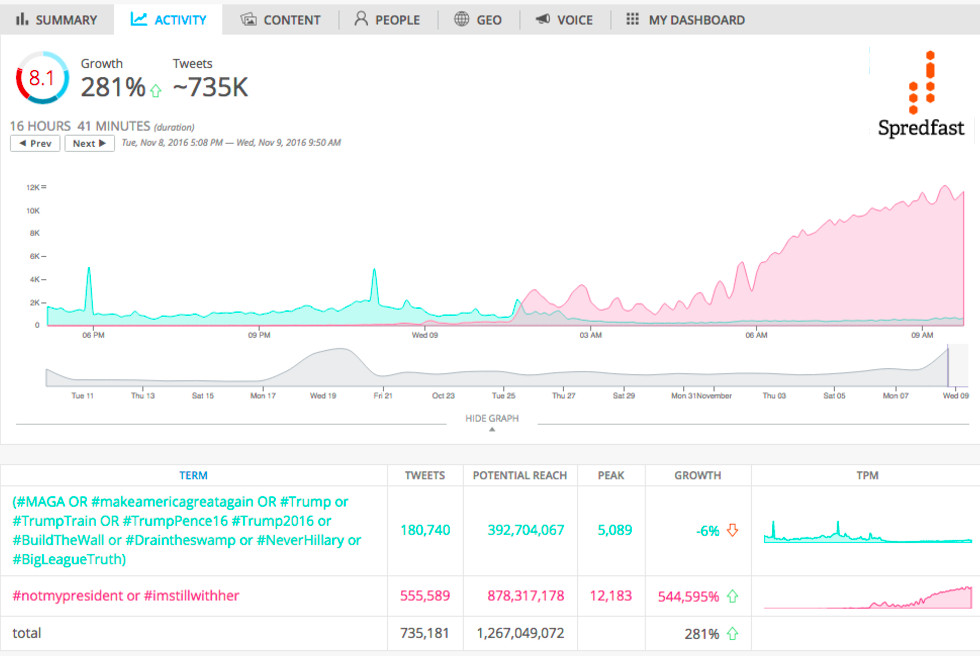
There’s also been a huge rise of trending topics against trump this morning (#NotMyPresident and #ImStillWithHer), which dwarf his support numbers so far.
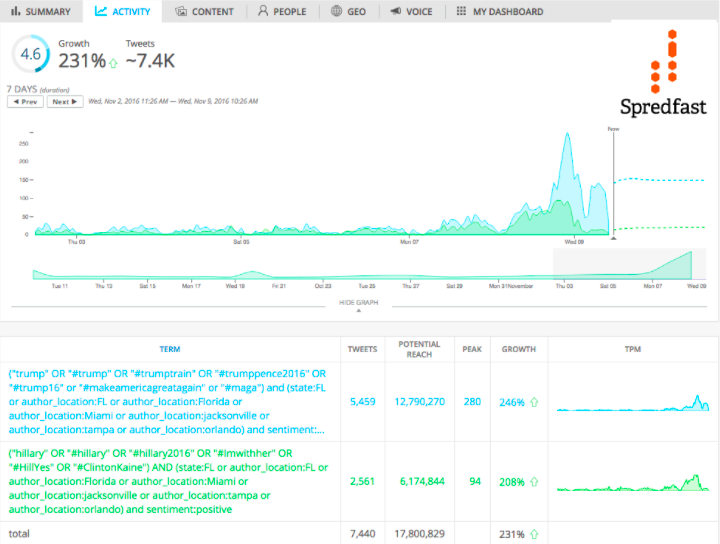
Florida
Pennsylvania
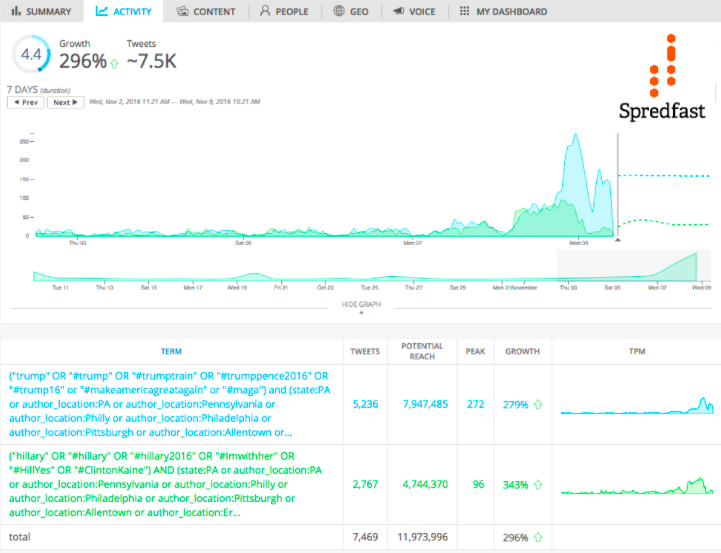
- Source: Twitter
- Search Terms: #ElectionDay and #ElectionNight
- Time: (Last 24 hours – 2:05 AM EST – 2:05 AM EST)
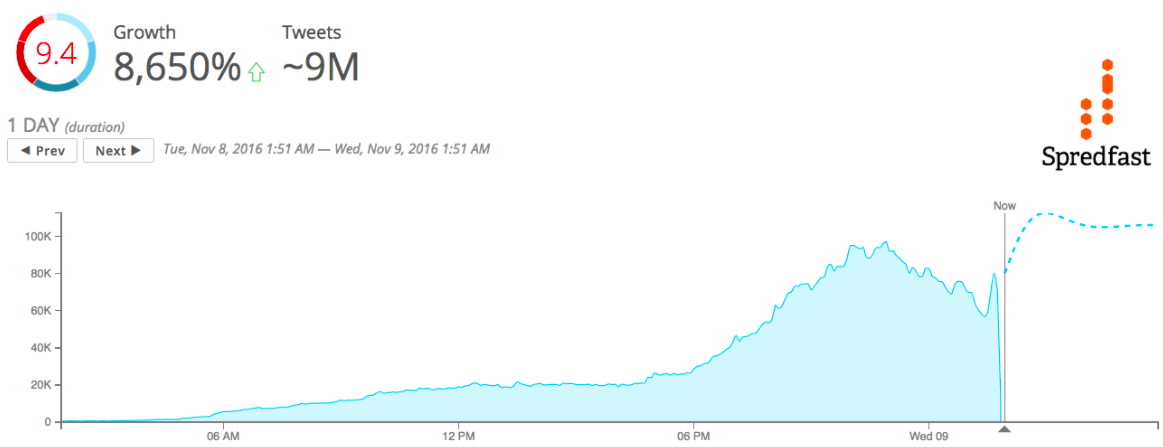
- 11:20 PM EST with 96K tweets per minute: As the race drew closer and signs of cracks in the blue wall began to show, the Canadian immigration website crashed as Americans rushed to investigate their exit strategy. Example Tweet
 Throughout the day, Hillary campaign hashtags accounted for 4x as much volume as Trump campaign hashtags, however, as the evening wore on we saw a dramatic shift. (Clinton = Blue, Trump = Orange)
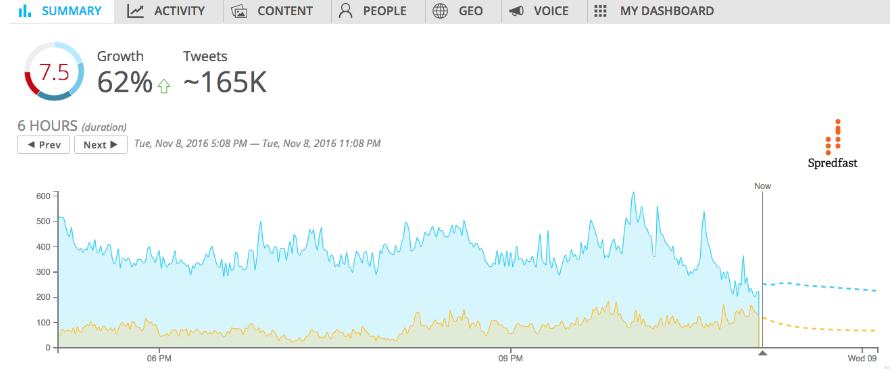
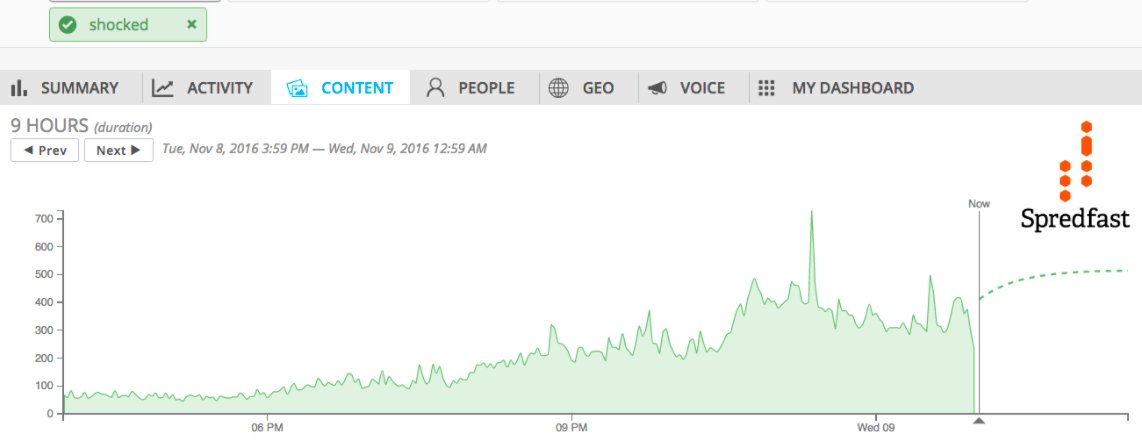
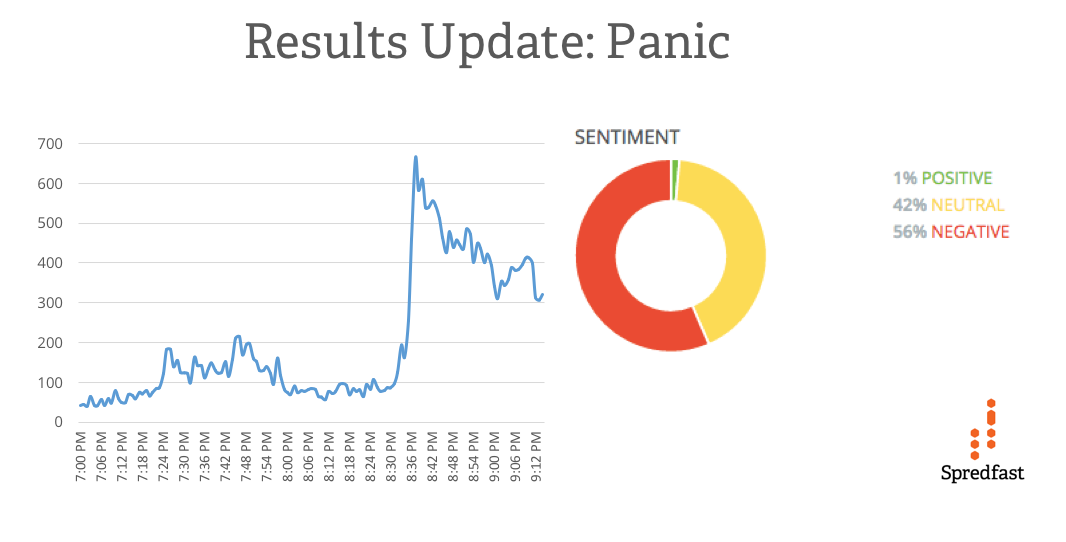
The word “Panic” took off as Hillary supporters became concerned with early returns results from Florida and Virginia.
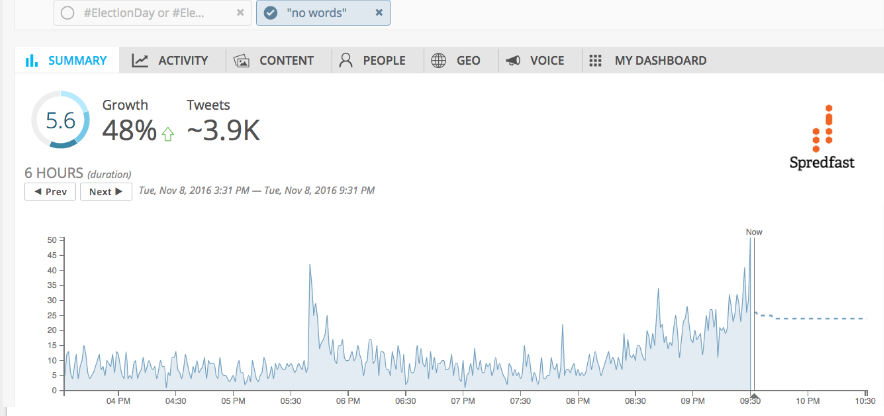
 For the first time in this election, Twitter was at a loss for words. Mentions of “no words” soared for 3.9K in 6 hours.